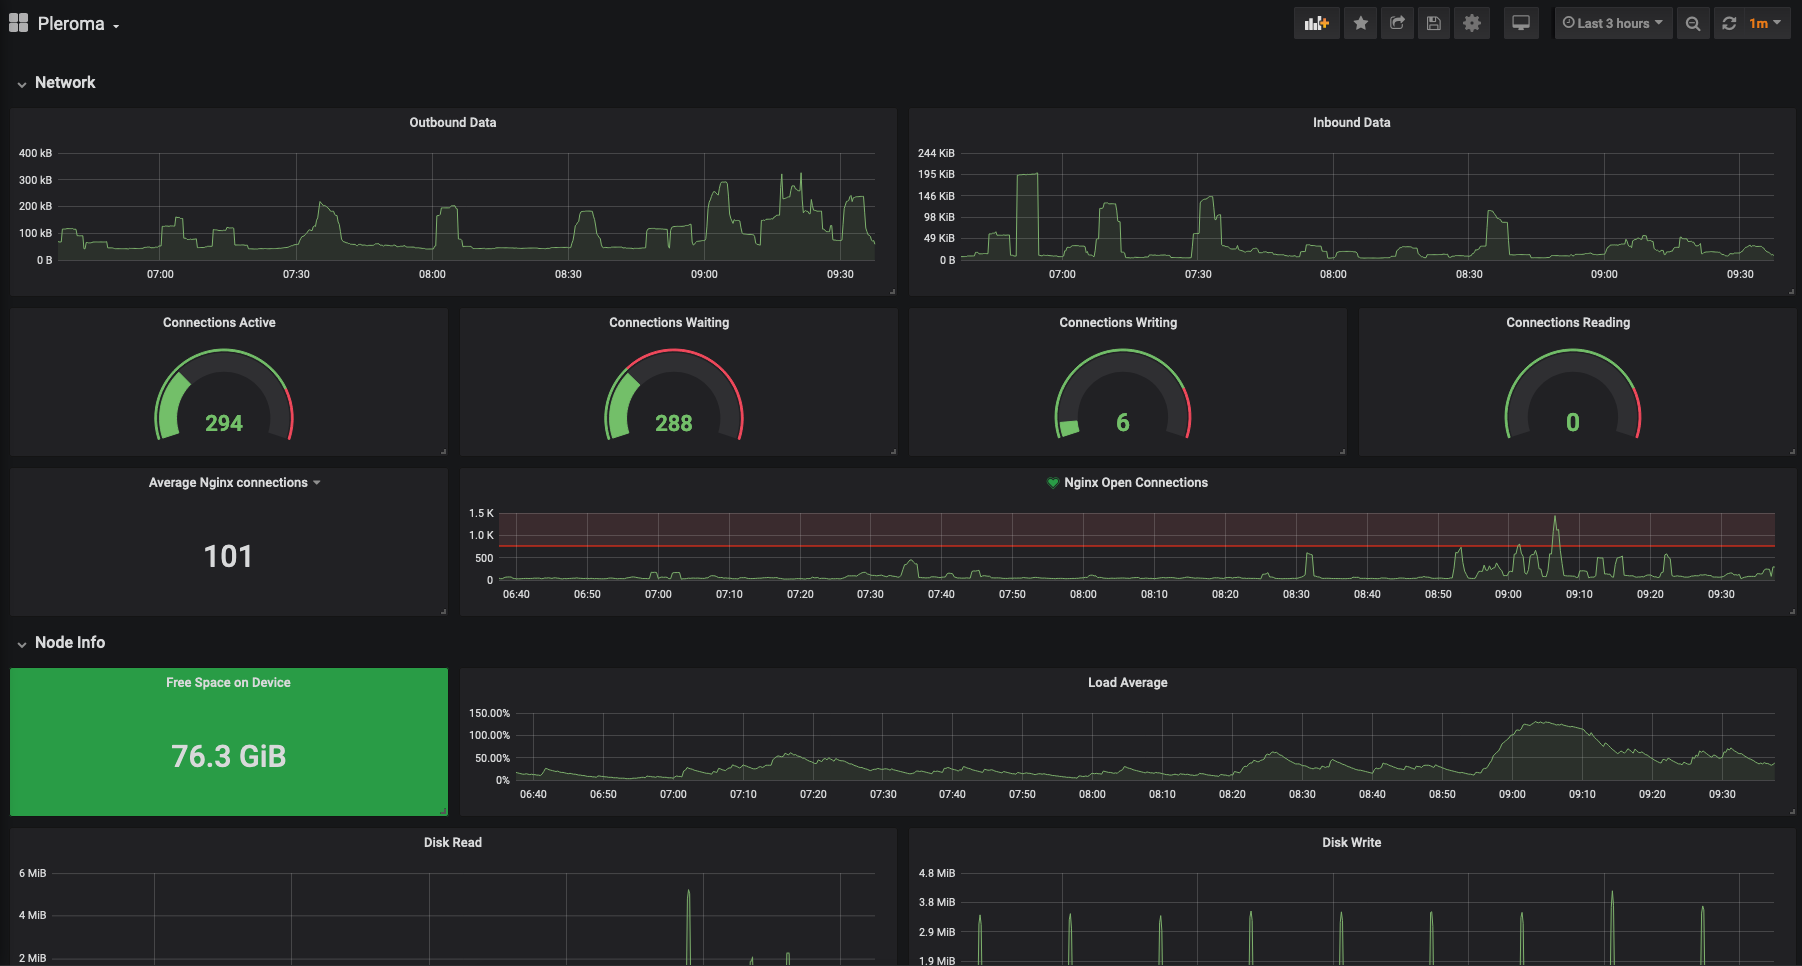
Monitoring Pleroma with Grafana and stuff
So let's say you run pleroma. Great, thanks for running it, the more nodes the better.
But you want to keep an eye on how it's doing, right? Just to make sure it's always alive and not eating resources and such.
Luckily tools to do this (and make you able to see vvvv pretty graphs) are out there. Let's walk through setting up a basic prometheus and grafana setup for maximum aesthetic.
Pre-requisites
I'm assuming that you've already got nginx set up for pleroma, but if you want to monitor from a remote location, make sure you've got that installed.
You've probably also got an SSL certificate. You'll want to expand that to cover stats.MYFEDIVERSE.com.
You'll also need a user to run all of this
sudo useradd -m -s /bin/bash monitoring
Installing Prometheus
So let's explain what we're setting up here - Prometheus is what we call a "time series database", which stores data against the time that it was produced. You give it a list of URLs to scrape, and it'll dutifully check that every so often and store it.
Luckily a lot of this monitoring stuff is golang so we can just wget a binary and it'll "just work.
Check the prometheus website for the latest version, at the time of writing that's 2.13.1, so that's what i'll give instructions for
sudo -Hu monitoring bash
cd /home/monitoring
wget https://github.com/prometheus/prometheus/releases/download/v2.13.1/prometheus-2.13.1.linux-amd64.tar.gz
tar xf prometheus-?.??.?.linux-amd64.tar.gz
mv prometheus-?.??.?.linux-amd64 prometheus
rm prometheus-?.??.?.linux-amd64.tar.gz
cd prometheus
This will download the binary and unpack it. Now we have this, let's set it up to monitor pleroma.
Configuring Prometheus
Open the config file prometheus.yml with your favourite editor
You'll notice that it's pretty readable. The stuff we care about is near the bottom, under scrape_configs.
What this is saying is "we have a job named prometheus, it'll scrape statistics from localhost:9090. It's there
so prometheus can monitor itself. Guess we know who watches the watchers now.
So let's set it up
Make the scrape_configs section resemble:
scrape_configs:
  - job_name: 'prometheus'
    static_configs:
    - targets: ['localhost:9090']

  - job_name: 'pleroma'
    metrics_path: /api/pleroma/app_metrics
    scheme: https
    static_configs:
    - targets: ['YOUR_FEDIVERSE.com']
and save!
Running Prometheus
Now we've downloaded it and set it up, all that remains is to run it.
Exit from the monitoring user's prompt and install the following systemd file to
/etc/systemd/system/prometheus.service (or if you don't run
systemd i'm sure you're more than capable of writing your own unit file)
[Unit]
Description=Stats
After=network.target

[Service]
User=monitoring
WorkingDirectory=/home/monitoring/prometheus
ExecStart=/home/monitoring/prometheus/prometheus --config.file=./prometheus.yml
ExecReload=/bin/kill $MAINPID
KillMode=process
Restart=on-failure

[Install]
WantedBy=multi-user.target
And run it with
sudo systemctl daemon-reload
sudo systemctl start prometheus
sudo systemctl enable prometheus
you can check that it's running with sudo systemctl status prometheus
If all goes well it'll say "running" and we're good to continue.
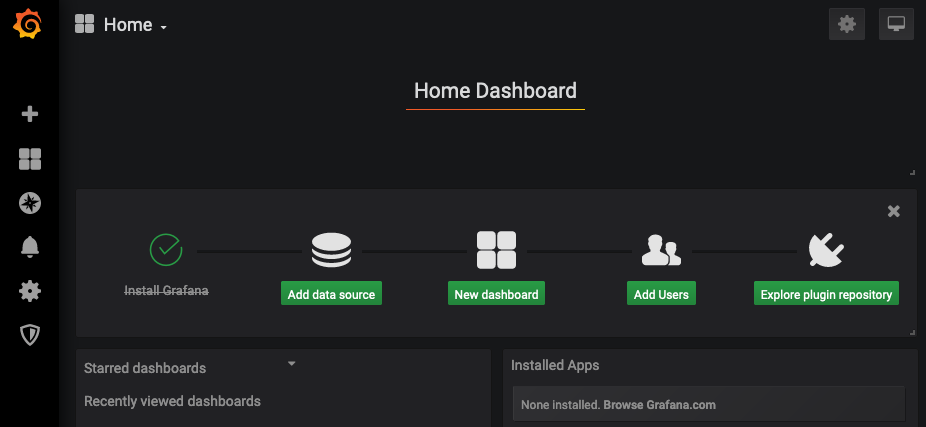
Installing Grafana
Now we've got the data being pulled from pleroma to prometheus, we need a way to visualise it all!
The most common way to do this is with grafana.
Let's go do it.
Follow the instructions from grafana.com to
install it - I personally used the .deb but I'm sure they all work.
Once you've installed it, it'll either have added the systemd file itself, or alternatively you'll have to make one. Follow the instructions on the wbesite.
sudo systemctl start grafana-server
sudo systemctl enable grafana-server
Hooking Grafana up to nginx
So ok you've got grafana running locally, now we need to access it remotely
Shove the following nginx config at /etc/nginx/sites-available/grafana
server {
    listen 443 ssl;
    listen [::]:443 ssl;
    ssl_certificate      /YOUR/PATH/TO/cert.pem;
    ssl_certificate_key  /YOUR/PATH/TO/private.key;
    ssl_protocols       TLSv1 TLSv1.1 TLSv1.2;
    access_log /var/log/nginx/prometheus.access.log;
    server_name stats.MYFEDIVERSE.com;
    location / {
        include proxy_params;
        proxy_pass http://localhost:3000;
    }
}
Then run
sudo ln -s /etc/nginx/sites-available/grafana /etc/nginx/sites-enabled
sudo nginx -t
# MAKE SURE THAT THIS EXITS OK
sudo systemctl reload nginx
And point your domain's stats subdomain at your server.
Configuring Grafana
Once your DNS propagates, you'll see a login page when you visit https://stats.MYFEDIVERSE.com
The credentials are admin/admin by default.
Click on "add data source", then "prometheus"
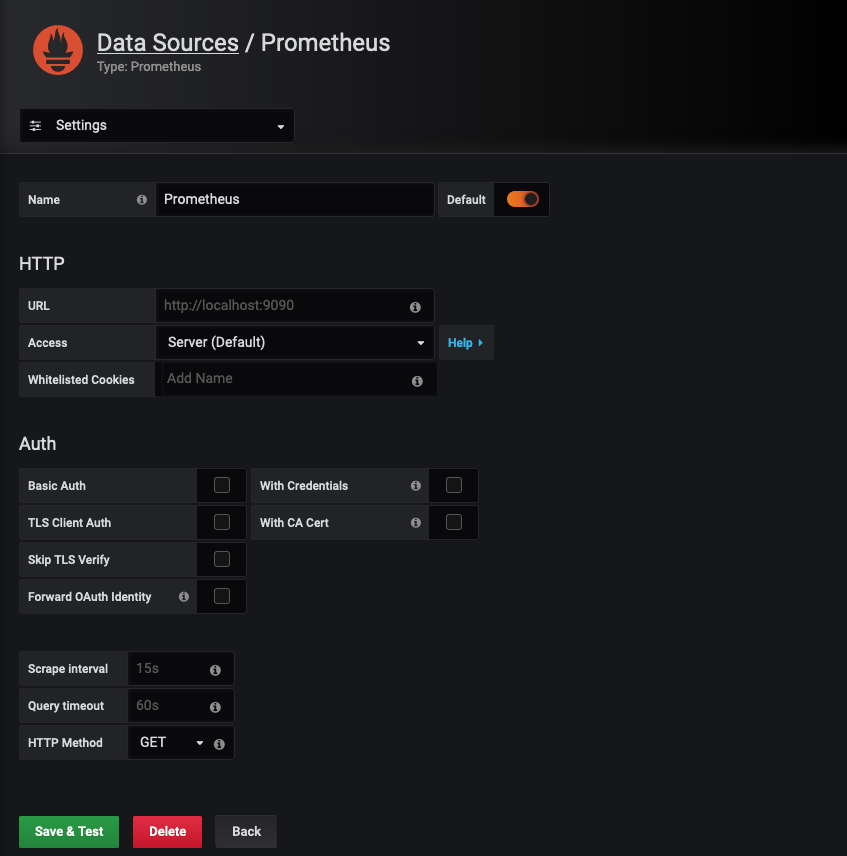
Your config should be largely default. URL will be http://localhost:9090
Hit Save & Test

Making a pretty graph
Now we've got everything working, we can make graphs!
Click the little "+" in the sidebar, then "Add Query"
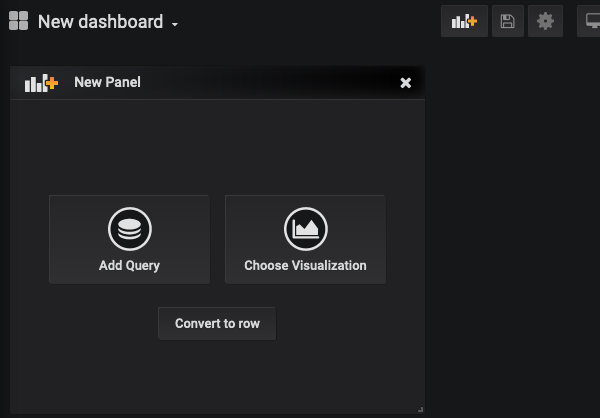
If you click the dropdown of "metrics", you'll see a list of things you can graph
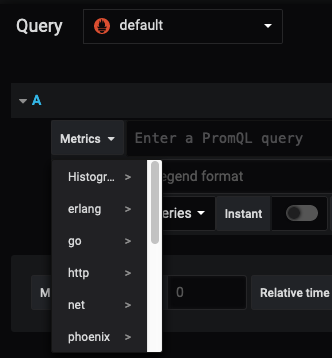
Let's start by making a graph of HTTP requests to our fediverse instance.
Click on http_requests_total and you'll see a load of lines. That's good, means it's all working
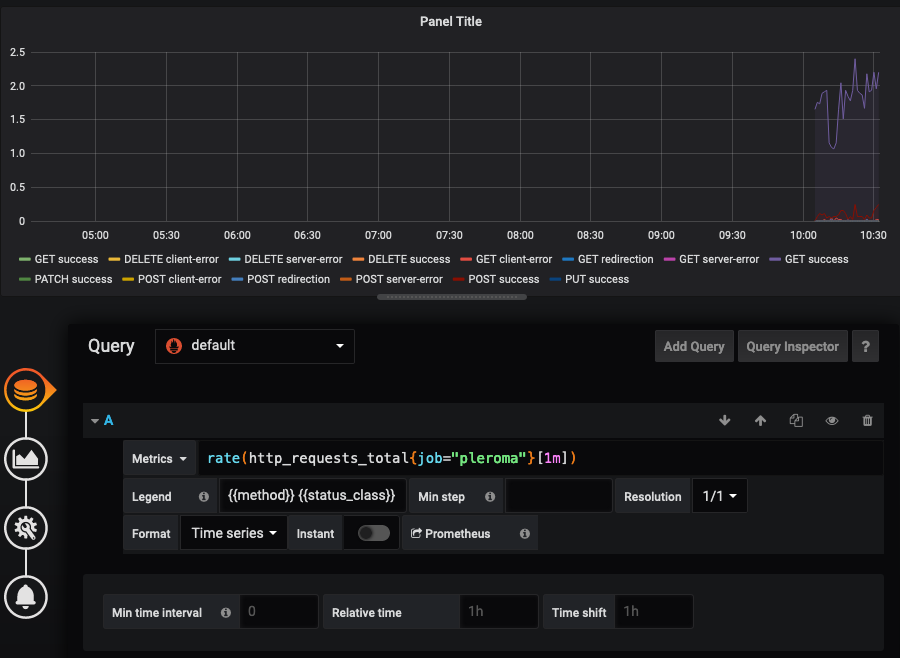
Change the query to this. I'll explain it in a second
rate(http_requests_total{job="pleroma"}[1m])
And suddenly you'll get a much nicer graph. Ok explanation time. This says "take the rate of increase of: the total http requests
that have the label job=pleroma over the last 1 minute"
You'll notice that the legend is quite messy. Let's change that.
In the Legend input, {{method}} {{status_class}}
You'll now see something like this
Hit the little cog icon on the left, and set a panel title.
Then hit the save icon right at the top - it'll redirect you to your dashboard. Hooray!
As a super special query, you can try sum by (status_class)(rate(http_requests_total{job="pleroma"}[1m])).
What this does and why is left as an excercise to the reader.
Adding more data
The following are a set of useful "exporters" that you can configure prometheus to scrape in the same way as described above, and graph to add MORE DATA
- Nginx exporter for more detailed connection info
- Node exporter for CPU/IO info
And one that uses a different data source, if you want